Mesa Gallium 驱动框架
Gallium Framework
引用 Mesa3D 官方文档的话,Gallium 本质上是一种应用程序接口,用于编写与设备基本无关的图形驱动程序。它提供了多个对象,以简单明了的方式封装了图形硬件的核心服务。据说,Gallium 的设计是借鉴了 DirectX。
它提供的比较核心的对象,我觉得有
pipe_screenpipe_contextpipe_resourcepipe_surfacepipe_framebuffer_state
一开始看 Gallium 时,疑问为什么没有 pipe_device, 其实很简单,Gallium 这一套 API 之所以可以用来编写与设备基本无关的图形驱动程序,可能就是因为它没有抽象 device 这个数据结构。
Gallium 确实是一组 API, 因为 pipe_screen 里是一大堆函数, pipe_context 里也是一大堆函数。虽然 Gallium 没有定义 pipe_device, 但几乎与硬件设备相关的一切都包含在了 pipe_screen, 一个 pipe_screen 同时可以追踪多个 pipe_context, 每个 pipe_context 里都有一个指向它所在的 pipe_screen 的指针 (handle)。
当一个 Gallium 驱动初始化时,第一个调用的函数就是 driCreateNewScreen3()
1 | /** |
flowchart TD
    A["__glXInitialize()"]
    B["AllocAndFetchScreenConfigs()"]
    C["dri3_create_screen()"]
    D["`**driCreateNewScreen3()**`"]
    E["dri2_init_screen()"]
    F["pipe_loader_create_screen()"]
    G["pipe_loader_create_screen_vk()"]
    H["pipe_loader_drm_create_screen()"]
    I["pipe_xxx_create_screen()"]
    J["`**xxx_create_screen()**`"]

    A --> B --> C --> D --> E --> F --> G --> H --> I --> J
State Tracker
flowchart TD
    A["vbo_exec_FlushVertices_internal()"]
    B["vbo_exec_vtx_flush()"]
    C["vbo_exec_copy_vertices()"]
    D["st_prepare_draw()"]
    E["st_validate_st()"]
    F["st_update_framebuffer_state()"]
    G["st_manager_validate_framebuffers()"]
    H["st_framebuffer_validate()"]

    A --> B --> C --> D --> E -- ST_NEW_FB_STATE --> F --> G --> H
st_validate_st() 可能会更新很多状态,像 ST_NEW_FB_STATE 如果 dirty, 那么就会调用 st_update_framebuffer_state() 函数。
grep -Po 'ST_STATE\(ST_.*?\)' src/mesa/state_tracker/st_atom_list.h | awk -F"[(,)]" '{printf "| %-26s | %-32s |\n", $2, $3}'
| STATE | HOOK |
|---|---|
| ST_NEW_DSA | st_update_depth_stencil_alpha |
| ST_NEW_CLIP_STATE | st_update_clip |
| ST_NEW_FS_STATE | st_update_fp |
| ST_NEW_GS_STATE | st_update_gp |
| ST_NEW_TES_STATE | st_update_tep |
| ST_NEW_TCS_STATE | st_update_tcp |
| ST_NEW_VS_STATE | st_update_vp |
| ST_NEW_POLY_STIPPLE | st_update_polygon_stipple |
| ST_NEW_WINDOW_RECTANGLES | st_update_window_rectangles |
| ST_NEW_BLEND_COLOR | st_update_blend_color |
| ST_NEW_VS_SAMPLER_VIEWS | st_update_vertex_textures |
| ST_NEW_FS_SAMPLER_VIEWS | st_update_fragment_textures |
| ST_NEW_GS_SAMPLER_VIEWS | st_update_geometry_textures |
| ST_NEW_TCS_SAMPLER_VIEWS | st_update_tessctrl_textures |
| ST_NEW_TES_SAMPLER_VIEWS | st_update_tesseval_textures |
| ST_NEW_VS_SAMPLERS | st_update_vertex_samplers |
| ST_NEW_TCS_SAMPLERS | st_update_tessctrl_samplers |
| ST_NEW_TES_SAMPLERS | st_update_tesseval_samplers |
| ST_NEW_GS_SAMPLERS | st_update_geometry_samplers |
| ST_NEW_FS_SAMPLERS | st_update_fragment_samplers |
| ST_NEW_VS_IMAGES | st_bind_vs_images |
| ST_NEW_TCS_IMAGES | st_bind_tcs_images |
| ST_NEW_TES_IMAGES | st_bind_tes_images |
| ST_NEW_GS_IMAGES | st_bind_gs_images |
| ST_NEW_FS_IMAGES | st_bind_fs_images |
| ST_NEW_FB_STATE | st_update_framebuffer_state |
| ST_NEW_BLEND | st_update_blend |
| ST_NEW_RASTERIZER | st_update_rasterizer |
| ST_NEW_SAMPLE_STATE | st_update_sample_state |
| ST_NEW_SAMPLE_SHADING | st_update_sample_shading |
| ST_NEW_SCISSOR | st_update_scissor |
| ST_NEW_VIEWPORT | st_update_viewport |
| ST_NEW_VS_CONSTANTS | st_update_vs_constants |
| ST_NEW_TCS_CONSTANTS | st_update_tcs_constants |
| ST_NEW_TES_CONSTANTS | st_update_tes_constants |
| ST_NEW_GS_CONSTANTS | st_update_gs_constants |
| ST_NEW_FS_CONSTANTS | st_update_fs_constants |
| ST_NEW_VS_UBOS | st_bind_vs_ubos |
| ST_NEW_TCS_UBOS | st_bind_tcs_ubos |
| ST_NEW_TES_UBOS | st_bind_tes_ubos |
| ST_NEW_FS_UBOS | st_bind_fs_ubos |
| ST_NEW_GS_UBOS | st_bind_gs_ubos |
| ST_NEW_VS_ATOMICS | st_bind_vs_atomics |
| ST_NEW_TCS_ATOMICS | st_bind_tcs_atomics |
| ST_NEW_TES_ATOMICS | st_bind_tes_atomics |
| ST_NEW_FS_ATOMICS | st_bind_fs_atomics |
| ST_NEW_GS_ATOMICS | st_bind_gs_atomics |
| ST_NEW_VS_SSBOS | st_bind_vs_ssbos |
| ST_NEW_TCS_SSBOS | st_bind_tcs_ssbos |
| ST_NEW_TES_SSBOS | st_bind_tes_ssbos |
| ST_NEW_FS_SSBOS | st_bind_fs_ssbos |
| ST_NEW_GS_SSBOS | st_bind_gs_ssbos |
| ST_NEW_PIXEL_TRANSFER | st_update_pixel_transfer |
| ST_NEW_TESS_STATE | st_update_tess |
| ST_NEW_HW_ATOMICS | st_bind_hw_atomic_buffers |
| ST_NEW_VERTEX_ARRAYS | st_update_array |
| ST_NEW_CS_STATE | st_update_cp |
| ST_NEW_CS_SAMPLER_VIEWS | st_update_compute_textures |
| ST_NEW_CS_SAMPLERS | st_update_compute_samplers |
| ST_NEW_CS_CONSTANTS | st_update_cs_constants |
| ST_NEW_CS_UBOS | st_bind_cs_ubos |
| ST_NEW_CS_ATOMICS | st_bind_cs_atomics |
| ST_NEW_CS_SSBOS | st_bind_cs_ssbos |
| ST_NEW_CS_IMAGES | st_bind_cs_images |
Gallium API
resource_copy_region
1 | /** |
resource_copy_region 只能在 buffer 与 buffer 之间或 texture 与 texture 之间 memcpy, 而且源与目标的 format 必须相同。之所以不能做 buffers 与 textures 之间的 memcpy, 至少是因为缺少 stride 参数。一些硬件(如 nvidia) 可以通过专门的 copy engine 完成这些拷贝,但对于其它硬件可能需要一个 compute shader 去做这些拷贝。另一方面,那些专门的 copy engine 通常是比较慢的,所以只在那些带宽非常有限的 PCIe 传输场景下才有用。如果想利用全部的
VRAM 带宽(甚至 infinity cache bandwidth), 你很可能必须使用 compute shaders.
Gallium HUD
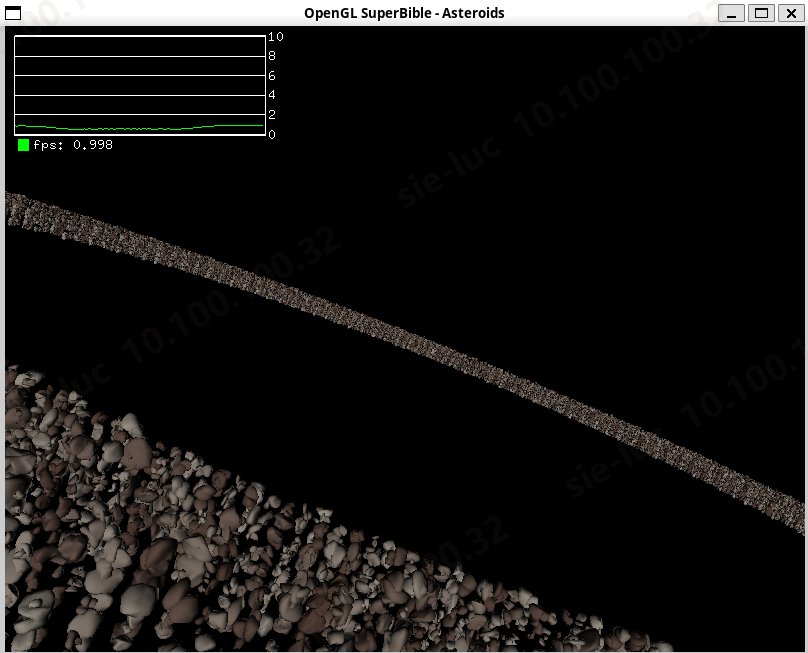
HUD (Head-up Display) 是 Gallium 一个用于观测图形应用的 fps, cpu 利用率等性能数据的内置功能,它有点像精简版的 MangoHud, 但它的方便在于集成在驱动内部,不管是普通的 Gallium 驱动,还是 Zink,它都可以使用。它的 mannual 可以通过环境变量 GALLIUM_HUD=help 看到
1 | Syntax: GALLIUM_HUD=name1[+name2][...][:value1][,nameI...][;nameJ...] |
